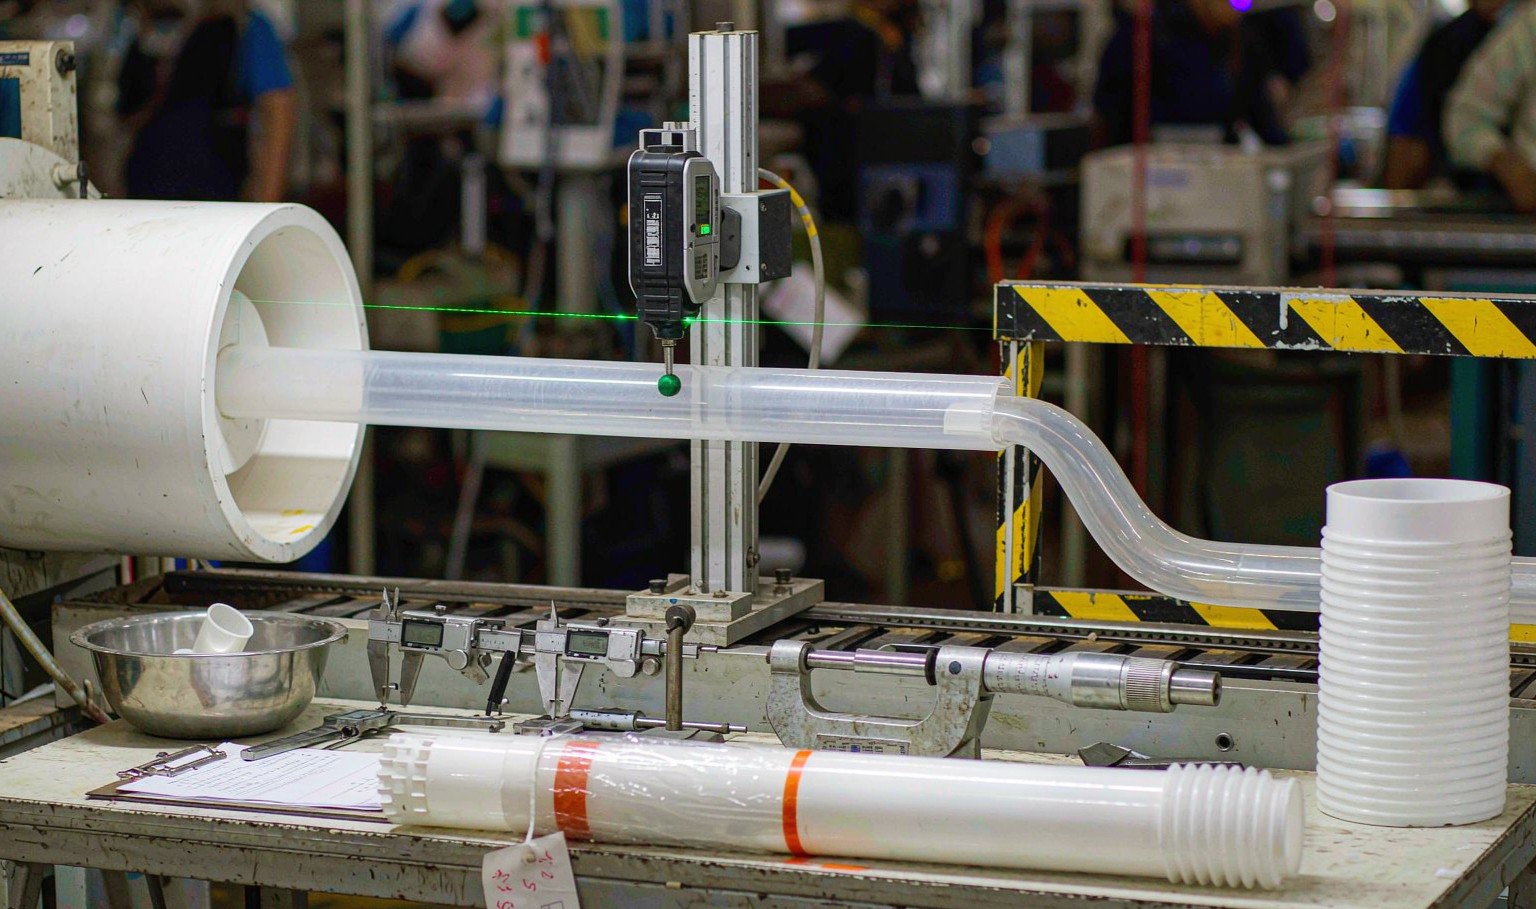
- 1. The premise: extrusion cannot be inspected into quality
- 2. The process parameters worth recording
- 3. Product measurements, and what they catch
- 4. SPC on a continuous process
- 5. In-line measurement: what is worth the money
- 6. Records: what to keep and for how long
- 7. Incoming material: the check most lines skip
- 8. A daily and weekly routine that actually runs
- 9. Handling a complaint without guessing
- 10. Frequently asked questions
The premise: extrusion cannot be inspected into quality
Injection moulding produces discrete parts, so you can sample them and, if the sample is good, reasonably assume the rest are. Extrusion produces a continuous stream at 30 metres a minute. A sample every 30 minutes represents roughly 0.2 % of the output, and the material between samples has already been packed.
That asymmetry is what shapes extrusion quality control. You cannot inspect your way to quality; you have to control the process so that the output is right by construction, and use inspection to confirm that control is holding.
The core principle: in extrusion, the important measurements are the ones taken on the line, continuously, on the process — melt temperature, melt pressure, output rate, haul-off speed, vacuum level. The measurements taken on the product afterwards are a check on whether those process values held. A QC system that only measures product is measuring history.
The process parameters worth recording
| Parameter | Typical setpoint | Tolerance to alarm | Why it matters |
|---|---|---|---|
| Barrel zone temperatures | Per material profile | ± 3 °C | Directly sets melt viscosity and output |
| Melt temperature at the die | Per material | ± 3 °C | The single most influential variable for dimensions |
| Melt pressure at the die | Per die | ± 5 % | Rising trend = screen blinding or die fouling |
| Screw speed | Per output | ± 2 % | Sets output on a single screw |
| Feeder rate | Per output | ± 1 % | Sets output on a starve-fed twin screw |
| Haul-off speed | Per draw-down | ± 0.5 % | Sets wall thickness and dimensions |
| Calibrator vacuum | 0.3 – 0.7 bar | ± 0.05 bar | Sets the profile against the calibrator |
| Cooling water temperature, in | 12 – 20 °C | ± 2 °C | Sets cooling rate and therefore shrinkage |
| Cooling water temperature, out | + 8 – 15 °C above in | Trend watch | A rising delta means flow is falling |
| Specific energy | Per material baseline | + 10 % | Early indicator of screw or die wear |
Table 1 — The process record. Every one of these should be logged automatically; none of them should be written down by hand from a dial.
Specific energy — kWh per kilogram — is the most under-used number in extrusion QC. It is the ratio of drive power to output, so it rises when the screw wears, when the die fouls, when barrel temperatures drift down, or when the material changes. A 10 % rise from the commissioning baseline means something has changed, and it usually shows up weeks before a dimensional defect does.
Product measurements, and what they catch
| Measurement | Instrument | Frequency | Catches |
|---|---|---|---|
| Overall dimensions | Caliper, or laser gauge in-line | Continuous (laser) / hourly (caliper) | Die wear, haul-off drift, thermal drift |
| Wall thickness | Micrometer, or ultrasonic | Every 2 h | Draw-down change, calibration fault |
| Weight per metre | Check-weigher on cut lengths | Every 50 parts | A fast proxy for wall thickness across the whole section |
| Straightness / twist | Surface table, dial indicator | Start of run, after changes | Cooling imbalance, stress |
| Surface | Visual against a limit sample | Continuous | Die lines, contamination, roughness |
| Colour | Spectrophotometer | Start of run, per batch | Pigment dosing, regrind ratio |
| Gel / contamination count | Visual count on a defined area | Per batch | Material quality, screw condition |
| Weld line integrity | Destructive bend or peel | Per shift | Melt temperature, die flow balance |
| Density | Immersion or pycnometer | Per batch of compound | Filler loading, foaming consistency |
Table 2 — Product measurements. Weight per metre is the most useful and the most neglected.
Weight per metre deserves its own note. On a fixed-length cut, weight integrates the entire cross-section: a wall that is 0.1 mm thin somewhere shows up as a weight deviation even though calipers at three points miss it. For a running check it is faster, more complete and more repeatable than any dimensional measurement. Its weakness is that it cannot tell you where the material is missing — so it pairs with a sectioned sample, not with a caliper.
SPC on a continuous process
Statistical process control works on extrusion, but the sampling plan has to respect the fact that consecutive metres are not independent. Samples taken 10 seconds apart are nearly identical; samples taken an hour apart include a shift change, a barrel temperature drift and possibly a material batch change.
| Subgroup design | Sample size | Interval | Detects |
|---|---|---|---|
| Too frequent | 5 | 2 min | Nothing — the variation within the subgroup is near zero, so the control limits are meaningless |
| Rational subgroup | 5 | 30 min | Drift within a shift |
| Between shifts | 5 | 4 h | Operator and set-up differences |
| Between batches | 10 | Per material batch | Compound variation |
Table 3 — Subgroup design. The most common error is sampling so often that the chart is blind to the variation that matters.
For a profile running at 30 m/min, a 30-minute interval is 900 metres of product. That sounds like a lot of unrepresented material, and it is — which is exactly why the process parameters in Table 1 are monitored continuously and the product measurements are the periodic confirmation.
Capability, honestly
A Cpk calculated from three days of data on a process that has not been running long enough to include a material batch change, a die clean and a shift change is not a capability figure. It is a description of a good afternoon.
| Cpk | Meaning | PPM out of tolerance (two-sided) | Verdict for extrusion |
|---|---|---|---|
| 0.67 | Poor | ~45,000 | Not acceptable for a specified dimension |
| 1.00 | Marginal | ~2,700 | Requires 100 % inspection |
| 1.33 | Capable | ~63 | The normal target |
| 1.67 | Good | ~0.6 | Comfortable; typical of a well-set PVC line |
| 2.00 | Excellent | ~0.002 | Rare in extrusion; usually means the tolerance is loose |
Table 4 — Capability. A Cpk of 2.0 on an extruded profile is more often a loose tolerance than a superb process.
Myth: "Cpk above 1.33 means no inspection needed." Capability describes a process in control. It says nothing about a die that is about to wear through, a batch of compound with the wrong filler loading, or a haul-off belt that is slipping. Capability justifies sampling, not the absence of inspection.
In-line measurement: what is worth the money
| Instrument | Cost | Measures | Worth it when |
|---|---|---|---|
| Laser diameter gauge (2-axis) | €8,000 – €25,000 | Two dimensions, continuously | Round or rectangular section, tight tolerance, high volume |
| Laser profile scanner | €25,000 – €60,000 | Full cross-section outline | Complex sections, medical or automotive |
| Ultrasonic wall thickness | €10,000 – €20,000 | Wall thickness at one or more points | Pipe and tube, thick-wall profile |
| Check-weigher | €3,000 – €8,000 | Weight per length | Almost always — the best value instrument on the line |
| Colour spectrophotometer, in-line | €15,000 – €30,000 | Colour continuously | Colour-critical work, high scrap cost |
| Surface defect camera | €20,000 – €50,000 | Gels, specks, scratches | Optical or appearance-critical profiles |
| Melt pressure transducer | €800 – €2,000 | Die pressure | Always — it is the cheapest early warning available |
Table 5 — In-line instruments. A melt pressure transducer at €1,000 buys more uptime than a laser gauge at €20,000.
The pattern in that table is worth stating plainly: the cheap process instruments prevent defects, and the expensive product instruments document them. Buy the pressure transducer and the check-weigher first, then the laser gauge when the volume justifies it.
Records: what to keep and for how long
| Record | Retention | Why |
|---|---|---|
| Process parameter log (per run) | 3 years | Reproduce a good run; investigate a complaint |
| Material batch and certificate | 3 – 5 years | Trace a compound problem |
| Dimensional inspection results | 3 years | Show the part was in tolerance when shipped |
| First-off / last-off samples | 1 year, physically | The only definitive record of what was shipped |
| Die maintenance history | Life of die | Predict rework; support warranty |
| Complaint and corrective action | 5 years | ISO 9001 requirement; trend analysis |
| Calibration records for instruments | 3 years | Without these, the measurements are opinions |
Table 6 — Records. The physical first-off sample settles more arguments than any spreadsheet.
Incoming material: the check most lines skip
Most extrusion defects that get blamed on the die are material problems. The incoming check does not need to be elaborate:
| Check | Method | Frequency | Rejects if |
|---|---|---|---|
| Moisture content | Moisture analyser, 3 g sample | Every bag or batch | Above the material's limit (PA 0.1 %, PC 0.02 %, WPC 0.5 %) |
| Bulk density | Graduated cylinder, tapped | Per batch | Outside ± 5 % of specification — affects feed and output |
| Melt flow rate | MFI tester | Per batch | Outside the supplier's declared range — affects draw-down |
| Filler content | Ash test (muffle furnace) | Per batch of filled compound | Outside ± 2 % absolute |
| Contamination | Visual on a spread sample | Per bag | Any foreign colour or black specks |
| Pellet size distribution | Sieve set | Per batch | More than 5 % fines — causes feed surging |
Table 7 — Incoming checks. The moisture and filler tests alone prevent most of the "the die is bad" complaints we investigate.
A daily and weekly routine that actually runs
Quality systems fail when they are too elaborate to be done on a busy shift. This is a routine that survives:
| Frequency | Task | Time |
|---|---|---|
| Every 30 min | Read and confirm process parameters against the set-up sheet; check surface visually | 2 min |
| Every 2 h | Dimension and wall thickness sample; weight per metre | 10 min |
| Per shift | Straightness and twist on a 1 m sample; weld line bend test; colour check | 20 min |
| Daily | Review specific energy against baseline; check tank water delta-T; inspect die face for drool | 15 min |
| Weekly | Full dimensional layout on 5 samples; die clean if pressure trend is up; calibration check on gauges | 2 h |
| Monthly | Capability review on all specified dimensions; scrap analysis by cause | 3 h |
| Per die | Record maintenance, output at commissioning, and any rework | As needed |
Table 8 — A routine that fits around production rather than stopping it.
Handling a complaint without guessing
- Get the sample and the numbers. A photograph is not a sample. Ask for the measured value, the instrument used and the date code.
- Match it to the run record. If the date code maps to a run whose parameters were normal, the cause is probably downstream — storage, transit, or the customer's process.
- Reproduce it. Run the recorded parameters and see whether the defect appears. If it does, the record is wrong or the material changed. If it does not, the defect is not from the extrusion.
- Check the obvious external causes before the die. Thermal expansion in a hot warehouse, banding pressure, one-sided sun, moisture pickup in polyamide. All of these produce defects that look exactly like process defects.
- Change one variable. The temptation under pressure is to change three settings at once and declare victory when the next sample is good.
The single most useful QC investment: a physical first-off sample, labelled with the date code, kept for every run. When a complaint arrives, comparing the returned part against the retained sample tells you in ten seconds whether the part changed after it left the line — which is the answer to roughly a third of all complaints.
Frequently asked questions
How often should I measure dimensions on a profile line?
At start-up every 15 minutes until three consecutive samples are stable, then hourly at steady state, plus after every setting change, material change or die clean. On a line with an in-line laser gauge, the gauge measures continuously and the caliper check becomes a confirmation every two hours.
What is the most common cause of out-of-tolerance product?
In our experience: haul-off speed drift, followed by melt temperature drift, followed by material batch variation. Die wear is fourth. That order is why the process log matters more than the die drawing.
Do I need a CMM for profile inspection?
Rarely. A surface table, a height gauge, a set of calipers, a micrometer with spherical anvils and a straight edge cover almost all profile work. A CMM becomes worthwhile when the profile has many interrelated features or when the customer requires a formal dimensional report with GD&T.
How do I set control limits on a new line?
Run the line until you have at least 25 subgroups under stable conditions — no die changes, no material changes. Calculate limits from those. Do not use the drawing tolerance as the control limit; control limits describe the process, specification limits describe the requirement, and conflating them removes your early warning.
What is a reasonable scrap rate for profile extrusion?
5 – 12 % total is typical for a mature line including start-up, changeover and rejects. A well-run PVC line on a stable product can be under 5 %. Above 15 % means either the process is not capable of the specification or the changeover frequency is too high for the batch sizes.
Should QC be in-line or in a lab?
Both, with different jobs. In-line measurements catch drift and trigger adjustment. Lab measurements — tensile, impact, density, thermal — verify that the material is what it claims to be, and cannot be done on a running line. A QC system with only one of the two is missing half its function.
How do I handle a customer who measures differently?
Agree the measurement method in writing before the first shipment: instrument, sample conditioning, support conditions, measurement points and temperature. Most tolerance disputes are measurement disputes, and a one-page method agreement prevents almost all of them.
Does ISO 9001 require SPC?
No — ISO 9001 requires that you monitor and measure product characteristics and that the measurement is valid. SPC is one way to do that; a documented inspection plan with records satisfies the standard. SPC is worth doing because it is more useful, not because it is required.
Setting up QC for a new profile line?
We can supply the inspection plan, the set-up sheet, the capability study format and the first-off sample discipline along with the tooling — so the line starts with a system rather than a set of gauges.




 EN
 ES
 FR
 DE
 PT
 AR
 RU
 JA
 KO
 IT
 NL
 TR
 PL
 ID