Speed is not a setting, it is a schedule
The injection speed on the machine screen is one number, and almost no shot runs at it. A screw moves at the commanded speed only while the pressure available exceeds the pressure the cavity demands. The moment demand exceeds the limit, the machine switches from velocity control to pressure control and the screw slows down on its own. Most moulds spend part of every fill in that second mode, and the operator who set the number has no idea which part.
That is the argument for profiling. If the fill is going to be pressure-limited somewhere anyway, it is better to choose where. A staged profile sets the speed by screw position, so the fast part of the fill happens where the flow path is thick and short, and the slow part happens where the flow is about to arrive and the risk is burning rather than shorting.
The distinction matters because the two failure modes are opposite. Too slow and the melt freezes before the cavity is full. Too fast and the air in the cavity cannot escape, the last material to arrive overheats from compression, and the part is burned at the far edge while the near edge flashes.
The pressure curve has a floor, and it is not at either end
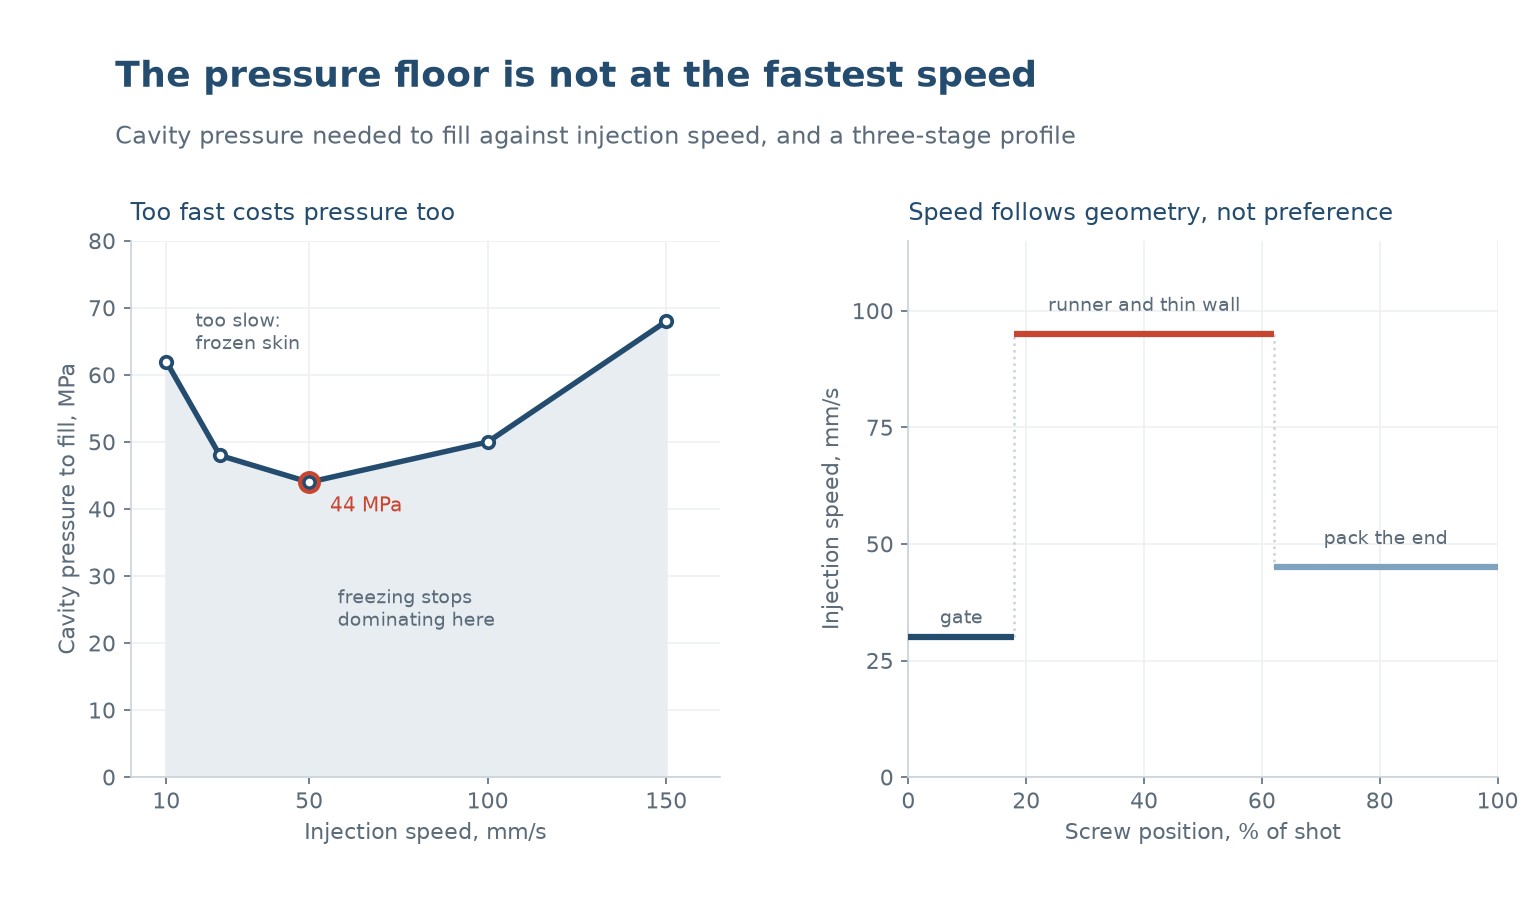
Measured across a speed range on a simple part, the pressure needed to fill is a U. At 10 mm/s it is 62 MPa, at 25 mm/s it is 48, at 50 mm/s it is 44, at 100 mm/s it is 50 and at 150 mm/s it is 68. The minimum sits in the middle, and both ends are expensive for different reasons.
At the slow end the cost is freezing. The melt touches a cold wall, a skin forms, and the skin grows through the fill. A thinner flow channel means a higher pressure gradient for the same flow rate, and past a point the growth of the frozen layer outruns the fill. The 62 MPa at 10 mm/s is not viscosity, it is a narrowed channel.
At the fast end the cost is viscous. Pressure drop rises with flow rate, and for a pseudoplastic melt it rises sublinearly rather than linearly, which is why the curve climbs gently from 44 to 68 rather than exploding. The sublinearity is shear thinning doing its job. It is not a reason to go faster, it is the reason going faster is affordable.
The practical reading is that the minimum of the curve is the speed at which freezing stops dominating. Below it, every extra millimetre per second buys pressure back. Above it, every extra millimetre per second costs pressure and buys nothing except a shorter fill time.
What each stage is actually for
A three-stage profile is enough for most parts, and each stage has one job.
| Stage | Where it runs | Job | Typical speed |
|---|---|---|---|
| First | Nozzle to gate | Cross the sprue before the melt cools in it | Slow, 20 to 35 mm/s |
| Second | Gate through the thin wall | Fill the restrictive section before it freezes | Fast, 60 to 100 mm/s |
| Third | Last 10 to 20 percent | Let the air out and avoid burning the far edge | Slow, 25 to 45 mm/s |
Table 1 — The three stages, what each one is protecting against, and the speeds that usually work
The first stage is the one most often skipped. A fast start drives melt through the sprue before the runner is full, and the result is a jet of material that curls into the cavity instead of a front that pushes the air ahead of it. That is jetting, and no amount of packing pressure removes the snake-shaped defect it leaves.
The third stage is the one most often set too fast. Decelerating before the cavity is full lets the last material arrive slowly, which gives the air time to leave through the vents and keeps the far edge from being adiabatically compressed. The cost is a slightly longer fill, and the benefit is that the part is not burned at the point furthest from the gate, which is exactly where a burn is hardest to polish out.
Where a profile creates a new defect
A profile is a series of accelerations, and every acceleration leaves a mark if it is in the wrong place. The transition position becomes a feature on the part, because the flow front slows and the skin that formed during the fast stage is suddenly exposed to a slower, cooler flow.
The visible result is a hesitation mark, a faint line across the part at exactly the screw position where the stage changed. On a textured or painted part it disappears. On a glossy visible face it is a reject, and it will be at the same place on every shot, which is how you know it is the profile and not the material.
| Symptom | Profile error | Fix |
|---|---|---|
| Hesitation line across the part | Stage change in the middle of a visible face | Move the transition to a rib, a corner or a hidden edge |
| Burn at the far edge | Third stage too fast or absent | Decelerate earlier and check the vents |
| Flash at the gate end | First stage too fast, pressure spikes at fill | Slow the first stage, raise the switchover point |
| Short shot in a thin rib | Second stage too slow | Raise the second stage and check the melt temperature |
| Jetting snake near the gate | Fast fill into an open cavity | Slow the first stage, aim the gate at a wall |
Table 2 — Reading a defect back to the stage that caused it
The transition should land on a geometric feature, not on a round number. A stage change at 45 percent of the shot that happens to fall across the middle of a visible face will produce a mark there on every part. The same change at 52 percent, landing on a rib, produces nothing.
Setting the transitions from a short-shot study
The transitions are not guessable from the drawing, because the relationship between screw position and cavity position depends on the shot size, the runner volume and the compressibility of the melt. The reliable method is a short-shot series: run the fill at a fixed speed, stop at a series of positions, and weigh and photograph each short shot.
The photographs tell you where the front is at each position. The weights tell you the fill is progressing linearly. Together they let you place a transition at the point where the front enters the thin section, and another where it reaches the last ten percent of the volume. It takes about an hour and it replaces a year of arguing about settings.
Then verify with a pressure trace. In a correctly profiled fill the cavity pressure rises smoothly to the switchover point, with no step and no plateau. A plateau means the machine has gone pressure-limited and the speed you set is not the speed you are running.
What to specify
A speed profile that can be transferred between machines has to be written in terms the next machine understands.
- Speed per stage in mm/s, not percent, because percent means a different speed on a different screw.
- Transition positions as a percentage of shot, referenced to a short-shot study.
- The melt temperature and the mould temperature the profile was validated at, since both change the freezing rate.
- The switchover point to packing, and whether it is position or pressure triggered.
- Which face of the part is visible, so the transitions can be kept off it.
Add the short-shot photographs to the tool file. They are the only record of what the fill was supposed to look like, and without them the next setup repeats the whole exercise.
Why does filling pressure go up again at high injection speed?
Viscous pressure drop rises with flow rate. Shear thinning makes the rise sublinear, which is why it is affordable, but it never becomes free.
Why is filling pressure high at very low speed?
The frozen layer grows during the fill and narrows the flow channel. The pressure is being spent pushing melt through a shrinking gap, not on viscosity.
What is a hesitation mark and what causes it?
A faint line where the flow front slowed. It appears at the screw position where a profile stage changed, on every shot, in the same place.
How do I choose transition positions?
From a short-shot study: stop the fill at a series of positions, weigh and photograph each shot, and place the transitions where the front enters a thin section or reaches the last ten percent.
Should the first stage be fast or slow?
Slow, 20 to 35 mm/s. A fast start jets through the sprue and curls into the cavity instead of pushing air ahead of it.
Can I transfer a profile between machines?
Only if the speeds are in mm/s and the transitions are in percent of shot. Percent-of-maximum settings do not transfer, because the maximum differs.
A fill that will not settle?
Send the part drawing, the gate position and the current speed settings. We will run a short-shot series and set the transitions from the geometry rather than from habit.



 PL
 EN
 ES
 FR
 DE
 PT
 AR
 RU
 JA
 KO
 IT
 NL
 TR
 ID